- The Analytics Ladder
- Posts
- Counting Coffees, Building Credibility: How Data Curiosity Becomes Career Leverage
Counting Coffees, Building Credibility: How Data Curiosity Becomes Career Leverage
Your weekly playbook to climb faster, lead sooner and earn more.
Tom Laubli
September 28, 2025

WHY THIS ISSUE MATTERS
I truly think data curiosity is the hallmark of an analyst’s caliber.
This issue shows how data curiosity makes analysts indispensable, bridging the gap between technical depth and real business impact
A simple framework for data curiosity
Your next interview? You can sell your data curiosity edge
INTRO
I really do believe that every great analyst has a tell.
It is that quiet refusal to accept the first number spit out by a query. It is the nagging feeling that the clean, simple answer is hiding a messy, more important truth.
This is data curiosity.
Not just the skill to find answers, but the incessant drive to listen to what the data is whispering, and to hunt for the stories it is not yet telling. It is the difference between reporting the facts and uncovering the plot.
The career ceiling for most analysts is not technical skill. It is a curiosity deficit. They deliver the requested metric but do not feel the pull to investigate its origins, its biases, or what it fails to capture. They see data as a resource to be queried, not a landscape to be explored. The analysts who break through are the ones who treat every dataset as a crime scene. They dust for prints, follow the leads no one asked them to, and expose the convenient lies a simple chart can tell.
Here is what happens when data curiosity drives your entire method.
I’m using Coffee as my opening proof.
lets go!
A handful of curated links
What I Do Before a Data Science Project to Ensure Success Link
A practical pre-project checklist to frame the decision, define business constraints, and align stakeholders—so your analysis changes outcomes and earns executive trust
What Makes a Good vs Bad North Star Metric Link
A rigorous method for selecting outcome-focused North Star metrics (and avoiding proxy traps) that drives cross-functional alignment and boosts your credibility with product and execs
Qualitative Cost of Delay by Black Swan Farming Link
A team-ready approach to quantify urgency and materiality, helping analysts prioritise work, know when to stop refining, and increase decision velocity across the portfolio
From coffee to career: curiosity that signals leadership readiness
So .. How many coffees have I consumed since 1995?
At first glance, it sounds trivial.
It is not.
It is a prompt that forces estimation, assumptions, structure, and restraint.
That is the work.
Data curiosity sits at the centre of it, the habit that turns vague questions into decisions leaders can use. Big call??
Leaders look for people who frame better questions, pick sound methods quickly, and stop when more precision will not change the call. Be that person - thats my thesis.
We start from first principles. No perfect dataset, no panic. Produce a clean estimate, then refine if new facts matter.
(Why 1995?? you should have asked … its when I started in the workforce for real)
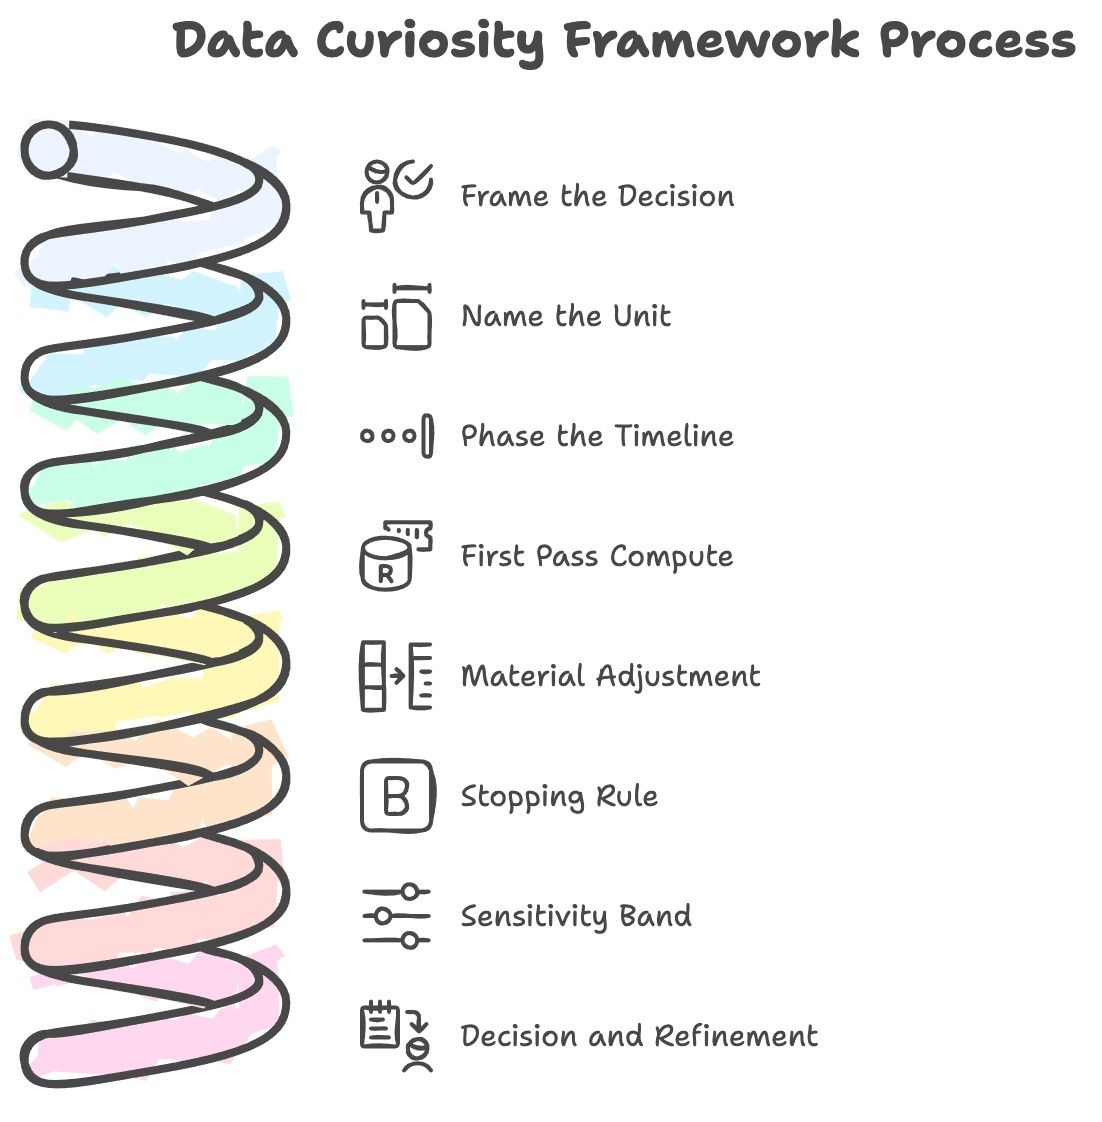
Define the unit first
For this thought experiment .. Before counting anything, i’m going to name the measure.
Cups are relatable, litres give physiological context, and Coffee Shot Equivalents (CSE) make different drink types comparable.
Let’s use CSE as the primary metric, keep cups and litres as secondary views.
Primary metric: CSE. One standard espresso shot equals 1.0 CSE.
Secondary metrics: cups for habit visibility, litres for total intake.
Set phase level defaults so the model is simple and auditable.
Formula:
CSE = cups × shots_per_cup
Litres = cups × cup_volume_L
Default conversions for this exercise:
Espresso single: 1.0 CSE, ~0.03 L serve volume
Long black double: 2.0 CSE, ~0.24 L
Latte, 250 to 300 ml small: 1.0 CSE by default
Latte, 350 ml or “double shot” order: 2.0 CSE
Plunger or filter, 250 ml mug: 1.0 CSE default unless you routinely brew weak, then 0.8 CSE
Note the word default. If we have hard evidence for a period, use it. Otherwise, pick a simple, single number assumptions per phase and document. Consistency beats false precision.
Now set the frame
No perfect dataset, no panic. Produce an initial estimate, then refine only if/when new facts materially shift the call
Assume 220 workdays a year. Thats with some holidays, days off etc.
We are also refining the question a little here .. Im interested in WORK related coffee consumption - ignore weekends, holidays, days off etc.
State the stopping rule up front: stop when the next refinement would not alter a reasonable decision about intake or behaviour.
With units fixed and rules stated, the rest of the analysis reads like a story rather than a spreadsheet.
The point is not coffee trivia. The point is a rehearsal for analytical leadership. I love this stuff!
Phase 1: lets get into it!
Early years, instant or filter, 1995 to 1999
Defaults: 2 cups per workday, 250 ml per cup, 1.0 CSE per cup.
Workdays: 1,100.
Cups: 2,200
Litres: 550
CSE: 2,200
Why it matters: a simple split takes memory and turns it into arithmetic. You can dispute volumes or strength, but I think the frame holds. If we later discover a stretch with weaker brews we can of course adjust the CSE per cup to 0.8 for that period. Unless it materially shifts totals, I think we may as well just leave it.
Curiosity is not hoarding trivia, it is choosing the right facts and discarding the rest.
Phase 2: Flesh it out further
Mid-career, café lattes, 2000 to 2016
Defaults: 3 lattes per workday, 300 ml per cup, 1.0 CSE per cup.
Workdays: 3,740 minus 400 coffee-free detox days (yes - I did a few long stints of NO coffee) = 3,340 effective days.
Cups: 10,020
Litres: 3,006
CSE: 10,020
Running totals after Phase 2:
Cups: 12,220
Litres: 3,556
CSE: 12,220
Where curiosity earns its keep: proxy traps. That third latte at 11 am looked like output. Often it was pressure, fatigue, or avoidance. The drink was a symptom not a driver.
(Side note .. Business has the same traps. Clicks can read as interest, often they are casual curiosity. NPS can read as loyalty, often it is a response to a single helpful moment. Time on page can read as engagement, sometimes it is confusion)
A curious analyst asks what the number really represents, when it holds, and when it misleads. Then they adjust only where the change will matter.
Phase 3:
Hybrid work, 2017 to today
Defaults: 2.5 cups per workday, 275 ml per cup.
Drink mix is split between home long blacks and small milk coffees.
Use a single phase-level factor of 1.2 CSE per cup to reflect the presence of occasional double shots without modelling every order.
Workdays: 1,923.
Cups: 4,808
Litres: 1,322
CSE: 5,770
Final totals (all phases)
Cups: 17,030
Litres: 4,878
CSE: 17,990
Two quick sensitivity checks keep the estimate honest.
Workdays: if your true average was 240 workdays per year, not 220, totals increase by about 9 percent. The decision you would make about intake or habits will almost certainly not be changed much if at all.
Strength in the hybrid era: if every cup were a single shot, total CSE would be about 17,028. If the average strength were closer to 1.4 CSE per cup, total CSE would land near 18,951. Both sit within a reasonable band that probably preserves the same behavioural recommendations. Hey - for this article its very rough, but you understand the principle right??
What this pattern shows??
First pass: anchor a defensible answer.
Second pass: sharpen with material facts, such as detox periods.
Third pass: only if a further refinement would change a reasonable decision.
Curiosity is not endless drilling. It is the judgement to stop when another loop will not move the call.
That discipline preserves decision velocity and avoids ornamental accuracy.
A simple stopping rule
State it up front, then honour it.
Purpose: estimate lifetime intake to set sensible habits and spot obvious risks.
Materiality: stop when the next refinement is unlikely to shift totals by more than 10 percent or change the habit you would adopt.
Next best refinement if stakes rise: audit the hybrid period strength factor using a one-week sample of actual shots pulled at home and orders recorded out of home.
Audit trail that others can trust
Make each step checkable by any colleague in five minutes. Named phases with single number defaults per phase.
Explicit formulae: CSE = cups × shots_per_cup. Litres = cups × cup_volume_L.
Visible adjustments: subtract detox days, do not bury them in a rate.
Stopping rule stated in plain language.
One-paragraph sensitivity showing a credible range.
You can now reuse the frame anywhere
This is the real prize. This is where you win.
A clear question, a sensible unit, a small set of defaults, a visible adjustment, and a stopping rule.
That toolkit travels. Finance will follow it. Product will follow it. Sales and operations will follow it.
You are not just presenting numbers. You are showing how to think with numbers.
That is what gets you invited into the conversation while the question is still shapeable.
From cups to calls
Im willing to bet careers stall in the gap between analysis and action
The fix is not more precision. It is better framing, faster iteration, and a shared standard for good enough to decide.
You can make that standard visible in a single paragraph any stakeholder will understand.
Try this pattern when you report out:
Question: We estimated lifetime caffeine exposure to set sensible habits
Method: Three phases, CSE as primary unit, single defaults per phase, detox adjustment, 10 percent materiality threshold
Result: About 17,989 CSE, within a 17,028 to 18,951 band
Decision: Introduce three decaf afternoons per week and a pre-deadline sleep audit. Revisit the strength factor only if symptoms persist
This is credibility in practice
Accuracy matters, credibility moves decisions. You earn credibility by making your reasoning easy to check. If someone challenges a step, you can show the assumption, the arithmetic, and the effect of a different input. Most changes will slide the total within the band. A few will cross the materiality threshold. Those are the only ones worth a new loop.
A brief checklist you can keep on your desk
Is the unit named, with a primary metric and sensible secondary views?
Are phase defaults single numbers, not moving targets?
Which adjustment is material, and is it explicit?
What is the stopping rule, and is it stated in plain language?
If the stakes doubled, what single refinement would you do next?
TADAA: That Analyst? Definitely Already Automated
Welcome to this week's special report on Career Annihilating Events. We're tracking the most significant job-killing news from the past seven days where AI is replacing the white-collar workforce. Here are the three most devastating stories that broke between September 21-27, 2025.
Editors note: In a super delicious and ironic twist, this one section of the newsletter we were trialling a new agentic news summarisation. Which works really well - except when the editor then goes on to insert the incorrect copy from much earlier trial runs!!. So .. the email edition that went out was - substantially hallucinated to say the least. We have in the meantime corrected the error and replaced it with what the silly editor should have included in the first place. Move fast and break things? Yep. When you make mistakes? Own up, fix it and charge on!
#1 MOST CAREER ANNIHILATING: Accenture Lays Off Over 11,000 Employees in Major AI-Driven Restructuring (September 26, 2025)
As of Sep 27, 2025, Accenture said it laid off over 11,000 staff in the past three months as part of an $865m restructuring programme, with CEO Julie Sweet indicating some employees will be exited where retraining is not feasible. This targets white-collar roles in data, analytics, and consulting, highlighting AI's role in automating tasks previously done by humans. Source
#2 MODERATELY CAREER ANNIHILATING: Top CEOs Warn of White-Collar Job Crisis from AI Revolution (September 27, 2025)
In late Sep 2025, CEOs and researchers amplified warnings: Anthropic’s Dario Amodei said AI could eliminate up to 50% of entry-level white-collar jobs, Amazon’s Andy Jassy said AI efficiency will reduce the company’s corporate workforce in the next few years, and Walmart’s Doug McMillon said AI will change virtually every job. The piece implicates AI in automating roles like data analysis and administration across sectors, signaling broad threats to analytics professionals without new skills. Source
#3 SOMEWHAT CAREER ANNIHILATING: Afraid of AI Replacing You? Here Are Jobs That May Be Future-Proof (September 26, 2025)
New SBS reporting on Barrenjoey research says nearly every Australian job will be transformed by tech and AI, with one in three at risk of substitution and most exposure concentrated in clerical, sales, manual, and machine-operation roles, while areas like tax preparation, legal advice, and education show the lowest substitution risk. This trend affects thousands of positions, emphasizing the need for adaptation in the analytics field. Source
Back to the point
Counting coffees is not a parlour trick. It is a low-stakes exercise that trains high-stakes habits.
Ask sharper questions.
Structure ambiguity.
Expose proxies.
Balance rigour with speed
Make the analysis conversational.
Then stop when another loop will not change the call.
You will find that the same frame carries into churn analysis, unit economics, launch readiness, risk reviews, and board packs.
Where did we end up? Cups: 17,028. Litres: 4,878. CSE: 17,989 within a sensible band
(The numbers are illustrative, and secondary to the point of the article)
What matters is the method.
You took a foggy question and turned it into a decision in a way others can follow, challenge, and reuse. Do that consistently and people will bring you into the room earlier.
That is where influence lives.
That is where careers accelerate
Best,
Tom.
P.S. If this coffee calc sparked your curiosity, here's where I'd refine it next.. Check in on the hybrid era's strength factor with a quick one week log of actual shots (probably home brews vs. cafe orders), and cross-check instant CSE defaults against real caffeine content data for those early years. For example, could shave about 20% off if weaker brews were the norm which I think is probably/anecdotally right. BUT - don’t forget about stopping when it gets too finnicky.
P.P.S. Fun fact: I crunched these numbers literally in a Melbourne coffee shop this Sunday morning, fueled by a Magic. Proved my own point. Curiosity turned downtime into insight. What's your next foggy question? Lol. (Lookup a Magic .. for someone that loves to actually taste coffee, they are truly what their namesake suggest)
P.P.P.S. Dont look too hard at my lack of a rounding policy. Mathematical purists can probably rip this apart. And completely miss the actual point.
Know one teammate who’s drowning in rework or worried AI is eating their job? Forward this to them—you’ll help them climb and unlock the new referral reward: the Delta Teams Playbook, your crisis-mode toolkit when the wheels come off.
Not on The Analytics Ladder yet? You’re missing the brand-new 90-Day Analytics Leadership Action Kit. It’s free the moment you join—your step-by-step playbook to win trust in 14 days, build a system by day 45, and prove dollar impact by day 90.
Disclaimer: Some of the articles and excerpts referenced in this issue may be copyrighted material. They are included here strictly for review, commentary and educational purposes. We believe this constitutes fair use (or “fair dealing” in some jurisdictions) under applicable copyright laws. If you wish to use any copyrighted material from this newsletter for purposes beyond your personal use, please obtain permission from the copyright owner.
The information in this newsletter is provided for general educational purposes only. It does not constitute professional, financial, or legal advice. You use this material entirely at your own risk. No guarantees, warranties, or representations are made about accuracy, completeness, or fitness for purpose. Always observe all laws, statutory obligations, and regulatory requirements in your jurisdiction. Neither the author nor EchelonIQ Pty Ltd accepts any liability for loss, damage, or consequences arising from reliance on this content.
Visit our website to see who we are, what we do. | |
Our blog covering the big issues in deploying analytics at scale in enterprises. |